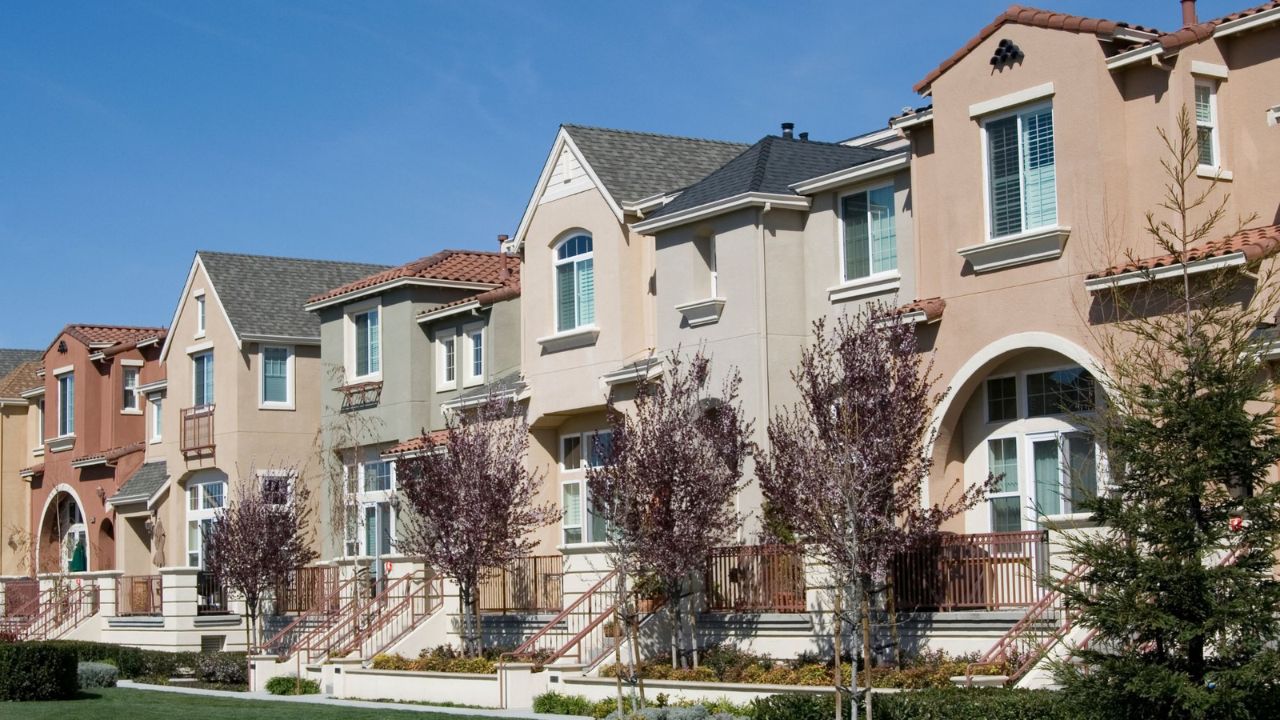
A household in the United States must now earn $114,000* annually to afford a median-priced home—marking a staggering 70.1% increase from six years ago, when the figure stood at $67,000.
The data, released in the latest Realtor.com April 2025 Housing Trends Report*, highlights the sharp rise in housing costs due to a combination of elevated mortgage rates and sustained home price growth.
This figure assumes a 30-year fixed mortgage, a 20% down payment, and limits housing costs to 30% of gross monthly income.
The required income now outpaces what many American households earn, exacerbating concerns around affordability and access to homeownership.
April marked the fourth consecutive month of annual declines in pending home sales, which dropped 3.2% year-over-year.
The trend follows a brief upswing in late 2024, but momentum has since faded—likely due to rising borrowing costs in early 2025.
As mortgage rates climbed again toward the end of April, many potential buyers chose to pause, injecting fresh uncertainty into the spring selling season.
Inventory on the Rise but Below Pre-Pandemic Norms
Despite affordability challenges, there are signs that market conditions may be slowly shifting in buyers’ favour. Active listings were up 30.6% year-over-year to 959,251, surpassing levels seen in April 2020.
New listings rose 9.2% year-over-year, and the share of homes with price reductions hit 18.0%, suggesting increased seller flexibility.
Still, the market remains tight. Inventory remains 16.3% below the 2017–2019 average, meaning buyers have more options than in recent years, but the market has not returned to pre-pandemic norms.
“Even with today’s affordability hurdles, meaningful changes in the market could give buyers a better shot at finding a home,” said Danielle Hale, Chief Economist at Realtor.com®.
“The number of homes for sale is rising, sellers are becoming more flexible on pricing, and while mortgage rates remain a challenge, the market is showing signs of rebalancing.”
Most Expensive U.S. Markets Require Over $200K Income
California dominates the list of metros requiring the highest household income to afford a median-priced home:
- San Jose-Sunnyvale-Santa Clara, CA: $370,069 (up 54.3% since 2019)
- Los Angeles-Long Beach-Anaheim, CA: $315,892 (up 86.0%)
- San Francisco-Oakland-Fremont, CA: $263,023 (up 30.5%)
- San Diego-Chula Vista-Carlsbad, CA: $258,926 (up 73.4%)
- Boston-Cambridge-Newton, MA-NH: $232,095 (up 81.9%)
- New York-Newark-Jersey City, NY-NJ: $208,687 (up 69.4%)
- Seattle-Tacoma-Bellevue, WA: $206,777 (up 54.9%)
These figures illustrate the affordability divide across major metropolitan areas, with some households needing incomes well beyond national averages.
Listing Prices Steady but Elevated
The median national listing price for April 2025 was $431,250, representing modest increases of 1.5% month-over-month and 0.3% year-over-year.
However, compared to April 2019, prices are up nearly 37%.
Price per square foot also rose to $233, a 1.1% increase from last year and a 54% increase from six years ago.
Buyers Regain a Bit of Leverage
The report suggests that while affordability is still a significant barrier, buyers are slowly gaining more leverage.
Listings with price reductions have increased, with notable shifts in metros such as Phoenix (31.3%), Denver (27.2%), and Dallas-Fort Worth (25.8%).
Metros leading in active listings growth include:
- San Diego, CA: +70.1%
- Washington, D.C.: +69.3%
- San Jose, CA: +67.6%
*All prices in US Dollars
*The full April 2025 Realtor.com® Housing Trends Report, including detailed metro-level data, is available online at mediaroom.realtor.com.